Visualize and interpret eval results
View results in the UI
Running an eval from the API or SDK will return a link to the corresponding results in Braintrust's UI. When you open the link, you'll land on a detailed view of the eval run that you selected. The detailed view includes:
- Diff mode toggle - Allows you to compare eval runs to each other. If you click the toggle, you will see the results of your current eval compared to the results of the baseline.
- Filter bar - Allows you to focus in on a subset of test cases. You can filter by typing natural language or BTQL.
- Column visibility - Allows you to toggle column visibility. You can also order columns by regressions to hone in on problematic areas.
- Table - Shows the data for every test case in your eval run.

Experiment table header summaries
Summaries will appear for score and metric columns. To find test cases to focus on, use column header summaries to filter by improvements or regressions (test cases that decreased in score). This allows you to see the scorers with the biggest issues. You can also group the table to view summaries across metadata fields or inputs. For example, if you use separate datasets for distinct types of usecases, you can group by dataset to see which usecases are having the biggest issues.
Now that you've narrowed your test cases, you can view a test case in detail by selecting a row.
Trace view
Selecting a row will open the trace view. Here you can see all of the data for the trace for this test case, including input, output, metadata, and metrics for each span inside the trace.
Look at the scores and the output and decide whether the scores seem "right". Do good scores correspond to a good output? If not, you'll want to improve your evals by updating scorers or test cases.

Interpreting results
How metrics are calculated
Along with the scores you track, Braintrust tracks a number of metrics about your LLM calls that help you assess and understand performance. For example, if you're trying to figure out why the average duration increased substantially when you change a model, it's useful to look at both duration and token metrics to diagnose the underlying issue.
Wherever possible, metrics are computed on the task subspan, so that LLM-as-a-judge calls are excluded. Specifically:
Durationis the duration of the"task"span.Prompt tokens,Completion tokens,Total tokens,LLM duration, andEstimated costare averaged over every span that is not marked withspan_attributes.purpose = "scorer", which is set automatically in autoevals.
If you are using the logging SDK, or API, you will need to follow these conventions to ensure that metrics are computed correctly.
To compute LLM metrics (like token counts), make sure you wrap your LLM cals.
Diff mode
When you run multiple experiments, Braintrust will automatically compare the results of experiments to each other. This allows you to quickly see which test cases improved or regressed across experiments.
How rows are matched
By default, Braintrust considers two test cases to be the same if they have the same input field. This is used both to match test cases across experiments
and to bucket equivalent cases together in a trial.
Viewing data across trials
To group by trials, or multiple rows with the same input value, select Input from the Group dropdown menu.
This will consolidate each trial for a given input and display aggregate data, showing comparisons for each unique input across all experiments.
Customizing the comparison key
However, sometimes your input may include additional data, and you need to use a different
expression to match test cases. You can configure the comparison key in your project's Configuration page.

Grid layout
When you run multiple experiments, you can also view experiment data side-by-side in the table by selecting the Grid layout. Braintrust will automatically compare each row across every comparison experiment that you've selected.
In the grid layout, you can select which fields to compare by selecting from the Fields dropdown menu.
Aggregate (weighted) scores
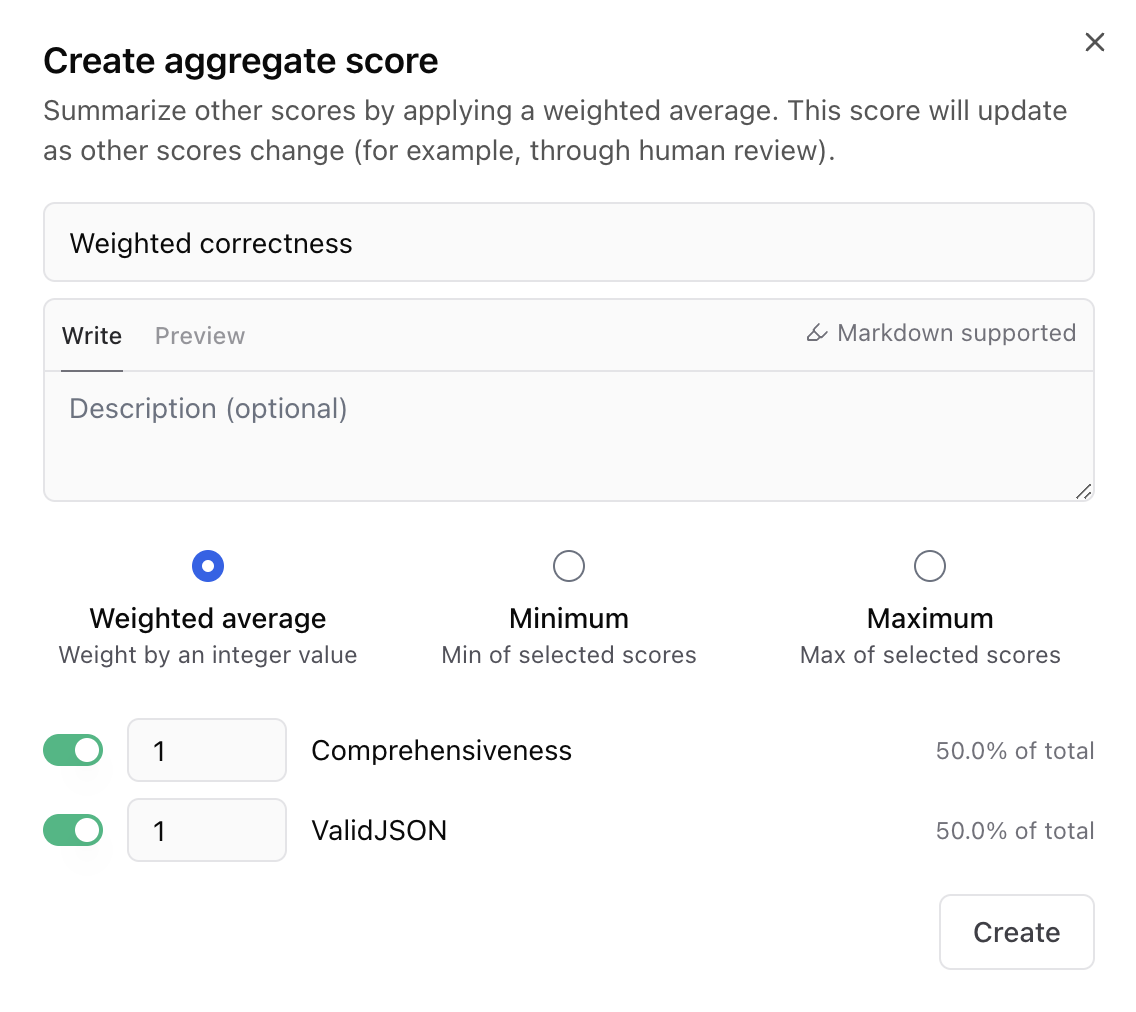
It's often useful to compute many, even hundreds, of scores in your experiments, but when reporting on an experiment, or comparing experiments over time, it's often useful to have a single score that represents the experiment as a whole.
Braintrust allows you to do this with aggregate scores, which are formulas that combine multiple scores. To create an aggregate score, go to your project's Configuration page, and select Add aggregate score.

Braintrust currently supports three types of aggregate scores:
- Weighted average - A weighted average of selected scores.
- Minimum - The minimum value among the selected scores.
- Maximum - The maximum value among the selected scores.
Analyze across experiments
Braintrust allows you to analyze data across experiments to, for example, compare the performance of different models.
Bar chart
On the Experiments page, you can select the fields you want to group by to create charts:
Scatter plot
Select a metric on the x-axis to construct a scatter plot. Here's an example comparing the relationship between accuracy and duration.
Export experiments
UI
To export an experiment's results, click on the three vertical dots in the upper right-hand corner of the UI. You can export as CSV or JSON.

API
To fetch the events in an experiment via the API, see Fetch experiment (POST form) or Fetch experiment (GET form).
SDK
If you need to access the data from a previous experiment, you can pass the open flag into
init() and then just iterate through the experiment object:
You can use the the asDataset()/as_dataset() function to automatically convert the experiment into the same
fields you'd use in a dataset (input, expected, and metadata).
For a more advanced overview of how to reuse experiments as datasets, see Hill climbing.